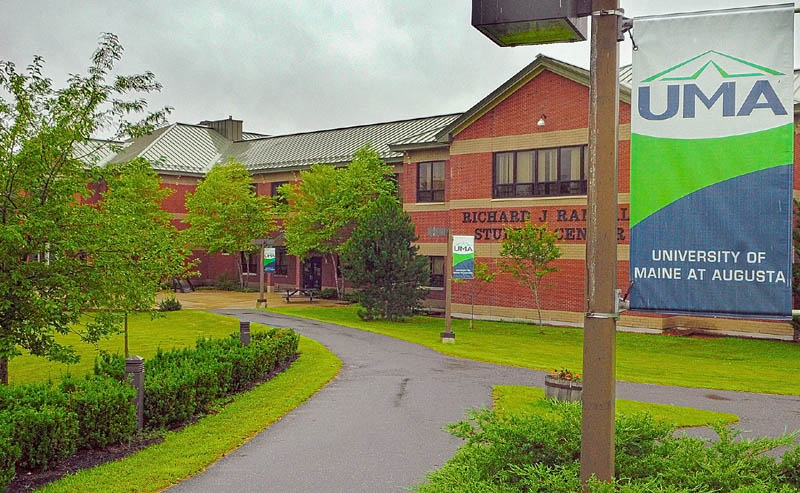
AUGUSTA — In a move that’s part public relations and part self-improvement, the University of Maine at Augusta has adopted a new model for assessing student and institutional success.
Colleges and universities are required by federal law to report their retention and graduation rates, and for UMA those numbers are poor: 48 percent and 17 percent, respectively.
UMA officials acknowledge that they need to boost those rates, but also argue that they don’t provide an accurate picture of what’s going on at the university because only a small minority of their students are counted.
“We need a way to tell our story,” said Gregory LaPointe, UMA’s executive director of institutional research and planning.
LaPointe is now crunching numbers with the Student Learning Progress Model, a system developed by an Alaska professor to track the educational outcomes of all students instead of just the first-time, full-time undergraduates counted in federal reporting. In fall 2012, only 311 of the 4,990 students enrolled at UMA — 6 percent — belonged to that group.
The model was beta-tested by 18 colleges and universities, including the University of Maine at Fort Kent. The institutions using the model hope to use the data to communicate with policy makers and potential students and to figure out how to help their students be more successful.
Look around UMA’s campus when classes are in session, and you’re likely to see students who transferred from another institution, working parents taking a course or two in the evenings and students who aren’t seeking a degree.
But look at retention and graduation rates from the federal government’s Integrated Postsecondary Enrollment Data System, or IPEDS, and those students disappear, and that’s 94 percent of UMA’s enrollment.
Older, part-time students who have previous college experience or first enroll sometime other than fall semester are often called “nontraditional students,” but they’re actually the norm at many colleges and universities, including most of Maine’s public institutions, and in particular, at community colleges.
IPEDS, however, is based on the old model of students graduating from high school, moving away from home and embarking on a college career of daytime classes, campus activities and late-night studying, while working part time if at all. These “traditional” students are now the minority in higher education.
Accommodating nontraditional — or, as some educators call them, “new traditional” — students requires adjustments in nearly every aspect of American higher education, including the way institutions collect, analyze and report data.
“Higher education needs a better way to view and understand student success,” said Gary Rice, who created the Student Learning Progress Model while at the University of Alaska at Anchorage. “And the public needs a better way to understand it, too.”
National rates low
Even for traditional students, graduation rates aren’t particularly good. The national figure for public, four-year universities is 56 percent.
The challenges are often greater for the nontraditional students who UMA, some of Maine’s other public universities and all of the community colleges have made it part of their mission to educate. Those students often face financial barriers or have to balance school against work and family obligations.
Three of the characteristics that make a student nontraditional — delaying college after high school, attending part time or working full time — have been identified by the National Center for Education Statistics as among seven risk factors associated with lower rates of postsecondary success.
“That is our student body,” said J.R. Bjerklie, associate director of institutional research at UMFK. “If we want to help our students succeed, we have to stop building strategies on traditional students.”
IPEDS looks at the cohort of first-time, full-time students who enter an institution in a given fall, then asks two yes-or-no questions: Did they return to the same institution the following fall? And did they graduate within 150 percent of the “normal time” for a degree, meaning three years for an associate degree or six years for a bachelor’s?
By contrast, the Student Learning Progress Model has two components, a tracking map and a successful learning rate.
The map tracks the students in a cohort over a 10-year period and assigns each to one of six statuses: graduated (with the credential they sought), interim award (earned some lesser credential), enrolled, intermittent (still a student, but not currently taking classes), transferred out and not enrolled. Most of the people counted as “not enrolled” have dropped out.
The learning rate calculates the percentage of courses each year for which the students in a cohort received a “D-minus” or a “passed.”
Rice said any grade above an “F” is considered success because the instructor has indicated that a student learned something, which he said is the fundamental purpose of higher education.
Both the map and the learning rate can be filtered by characteristics such as gender, race, age or financial aid status to reveal trends for different subgroups of students.
At the end of 10 years, UMA’s 2003 cohort of 1,507 degree-seeking students achieved the following outcomes: 357 graduated, 69 with interim awards; 91 enrolled; 38 intermittent; 602 transferred out and 628 not enrolled anywhere. The final numbers add up to more than 1,507 because a student can be in more than one status.
The successful learning rate for the 2003 cohort of first-time undergraduates ranged from 78 percent to 88 percent in their 10 years.
“This is a way for us to show that although our students aren’t graduating in four or six years, learning is happening,” LaPointe said. “Yeah, they’re not graduating, but they are acquiring knowledge.”
LaPointe said he wants more UMA students to graduate on time — or at all — but it may not be possible for someone like a working single parent.
LaPointe and Bjerklie said it’s not necessarily a problem when students are still taking classes after 10 years. LaPointe noted that he would be counted in that group because he’s working on a doctorate, and Bjerklie had his own long path through multiple institutions before earning a bachelor’s degree at age 29.
“It took longer than I might have wanted it to, it took a lot longer than mom and dad wanted, but I got it,” Bjerklie said. “Because all along, something was going on, something in classes or with other students, I was going to keep going back.
“If we can get to them, if we can keep them on the path, however slowly they’re walking, then we’re doing the job. When people drop out, that’s the loss. Those are the students we failed.”
UMA part of trend
The results of this more detailed dissection of data haven’t led to any concrete changes at UMA so far. But once university staff become more familiar with the system and use it to identify needs, it could inform strategies for supporting and retaining students.
The data could also give UMA and UMFK a new way to make a case to the public and to policymakers about their effectiveness in a period when student outcomes are receiving more attention.
In February, the White House released its College Scorecard initiative in an attempt to ensure that students are informed about their educational choices. The scorecards include IPEDS data on retention and graduation, as well as cost information.
In addition, the University of Maine System implemented a new funding system this year that allocates a portion of the system’s state appropriation based on student outcomes at each of the seven universities.
Graduation rate is not a factor, but number of degrees awarded is. UMA benefits from the formula’s emphasis on students older than 30, who make up half of UMA’s enrollment.
The leader of New England’s college accrediting agency said the institutions using the Student Learning Progress Model are part of a national trend of looking beyond IPEDS.
“The motivation, I think, for institutions with a broader student body is to really understand what’s going on with them and understand their pathways and figure out how to help them be more successful,” said Barbara Brittingham, director of the Commission on Institutions of Higher Education at the New England Association of Schools and Colleges, which is based in Burlington, Mass.
Much of this wouldn’t have been possible 20 years ago, before the advent of technology for processing huge amounts of data, and Brittingham said it could lead to real improvements in education.
Other institutions in Maine haven’t looked at the Student Learning Progress Model, but officials expressed interest in alternatives to IPEDS.
The University of Maine at Farmington, which bills itself as “Maine’s public liberal arts college” and has mostly traditional students, looks relatively good in IPEDS. Its retention rate is 74 percent, and its graduation rate is 59 percent, just behind the University of Maine’s 60 percent.
Even for UMF, however, IPEDS fails to capture about 20 percent of the enrollment that consists of transfer students. Director of Institutional Research Sarah Hardy makes sure to track those students’ outcomes separately, as well as in-state versus out-of-state students.
Helping students improve
Barbara Woodlee, former president of Kennebec Valley Community College and chief academic officer for the Maine Community College System, said she’d like to find out more about the Student Learning Progress Model because many of the colleges’ students wouldn’t be considered successful by traditional benchmarks.
“As we plan and design support services, the more we understand, the more effective we can be,” she said. “I’m eager to learn about any new model and particularly a model that would help us serve our part-time, older students better.”
The attention to student outcomes from political figures and advocacy groups is not just affecting colleges and universities.
Accrediting agencies are also feeling pressure, Brittingham said, because they vouch for the quality of educational institutions. Students aren’t eligible for federal financial aid unless they’re attending an accredited school.
The New England commission started placing more emphasis on retention and graduation rates several years ago, Brittingham said.
Each institution must submit a form documenting student success as part of every 10-year comprehensive review and five-year interim report. The form requires IPEDS data because it is standard across institutions, but it also encourages institutions to use other measures related to their individual missions.
The commission has no bright-line minimum standards that schools have to meet. Instead, Brittingham said, they’re looking for schools to acknowledge problems that may exist and to set and make progress toward reasonable goals.
UMA will make the Student Learning Progress Model part of its next review in spring 2015. UMFK has its next review in fall 2015.
Brittingham said it’s not clear how much attention the broader public pays to student outcomes data, whether from IPEDS or another system. College scorecards may make less of a difference than simple convenience.
“From what I’ve seen, it hasn’t yet caught on with the public,” she said. “I would say it’s probably unlikely that high proportions of students are picking where they go because of retention and graduation rates.”
Susan McMillan — 621-5645
smcmillan@mainetoday.com
Send questions/comments to the editors.


Success. Please wait for the page to reload. If the page does not reload within 5 seconds, please refresh the page.
Enter your email and password to access comments.
Hi, to comment on stories you must . This profile is in addition to your subscription and website login.
Already have a commenting profile? .
Invalid username/password.
Please check your email to confirm and complete your registration.
Only subscribers are eligible to post comments. Please subscribe or login first for digital access. Here’s why.
Use the form below to reset your password. When you've submitted your account email, we will send an email with a reset code.